
Charts WordPress plugins make it easy to add charts to your site. You need to use this kind of plugin, because most of the time, people don’t read a whole paragraph to understand the data. In that case, visualizing it using tables, charts, and other tools is an excellent idea.
It helps them to understand the result very easily and quickly. Adding any visualization of data to the site is a very complex process. You need to be a very skilled developer to do that.
But it can be easier if you use a plugin. A data visualization and charts plugin helps to create visualization tools without writing a single line of code. In this article, we’ll discuss such plugins.
Benefits of Using Data Visualization & Charts Plugin
- Don’t require a single line of code to add a visualization tool
- You don’t need to put things statically, it’s a fully functional automatic process
- Easier to manage the data
- Offers a variety of options for visualization
- Easy to maintain or update
Best Data Visualization & Charts WordPress Plugins 2024
1. Visualizer: Tables and Charts Manager for WordPress
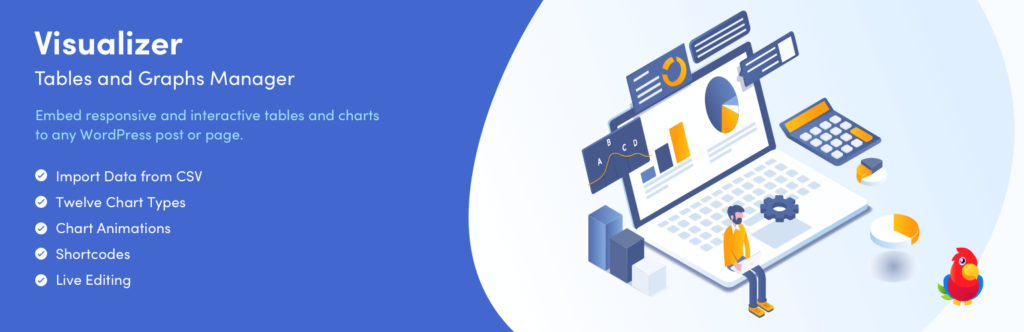
Visualization offers responsive visualizations. Using it, you can create tables, charts, and graphs without writing a single line of code. Besides making those visuals responsive, it also ensures cross-browser compatibility so that visitors from different browsers won’t face any issues while visiting your site.
This plugin also offers to import data for creating the visualizations so that you can handle large datasets easily. It supports any database integration for importing data. Overall, it supports 11 types of data visualization tools for displaying data on your website.
2. Ninja Tables – Best Data Table Plugin for WordPress

Ninja Tables offers to add price tables, comparing tables, product tables, and any other types of tables. It ensures that all of those tables are responsible for any kind of device. This plugin covers a vast area so that anyone can use it for adding data visualization tools.
From league point tables to affiliate product tables, you can add almost any type of chart or table using this plugin.
3. Formidable Forms

Though Formidable Forms is highly popular for creating forms, it also can be used to add any table, chart, graph, or data visualization tool. If you want to use a single plugin to create the contact form and data visualization, you may consider using Formidable Forms.
This plugin offers various ways of data visualization. You can add histograms, horizontal bars, pie charts, donut graphs, geo heat maps, area charts, and scatter graphs. Additionally, you can add the comparison between multiple data sets, and customize the charts as you need.
4. Graphina – Elementor Charts and Graphs

Graphina is a powerful charts WordPress plugin with hundreds of customization options for data visualization elements. Using this plugin, you can customize the table, charts, and graphs. It also allows custom positioning of the charts.
And adding real-time data for it. Overall, it’s one of the most customization-friendly data visualization plugins. So, if you’re looking for heavy customization in your data visualization, you can go for this plugin.
5. wpDataTables – WordPress Tables & Table Charts Plugin
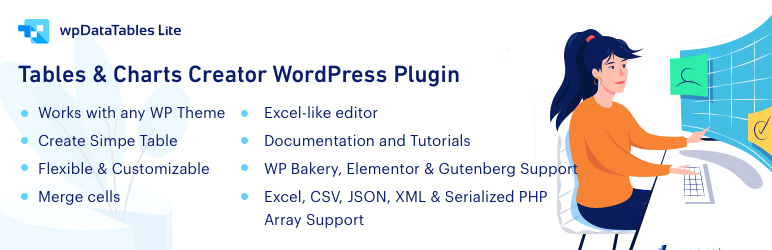
wpDataTables helps to create tables and charts for your WordPress-powered websites. Using this, you can quickly build tables and charts from Excel, CSV, XML, and JSON data formats.
This plugin can save a lot of time, and it doesn’t require any coding skills. You can easily use it without writing a single line of code. And the updated version of this plugin is more powerful than ever.
It allows customizing your tables, charts, and graphs according to your need. You can also add shortcodes in the cells.
6. WP Data Access

WP Data Access is a data-oriented charts WordPress plugin that can help you with setting data tables easily on your website. Using this Charts WordPress Plugin, you can create pixel-perfect, and responsive data tables in a minute. It has a data explorer that can help you to write SQL queries from the WordPress dashboard.
This plugin is responsive and customizable with too many data-driven functionalities. If you want to add more data-related options in a single plugin, we will recommend using this.
7. WP Charts and Graphs
WP Charts and Graphs is a responsive, updated, and user-friendly charts WordPress plugin that can help you to build your data visuals. It offers various types of charts and graphs, such as pie charts, bar charts, donut charts, etc.
Besides that, it can provide you with polls for general visitors that can help you to get data from the visitors. Also, these data can be used for marketing strategy. Also, it supports the shortcode that can come in handy.
Conclusion
We hope that you’ve found the right data visualization plugin for your website. Before installing any plugin, make sure it’s updated and compatible with your theme.
Also, make sure it doesn’t conflict with other plugins. In case, you’re confused about which plugin you should use, we’ll recommend you to use the Visualizer.